



Propagation Forge
Find the Current Solar Weather Conditions
if you find this app useful...
Propagation Forge
Live space weather, in plain English
Reading conditions…
Gray Line & Daylight
Estimated, not measured. This is a model built from the current solar flux, the angle of the sun at each point, and the K index — not live ionosonde readings. Treat it as a guide to the shape of the ionosphere today, not as a measurement.
Band Conditions
| Band | Daytime | Night | Explain |
|---|
Right Now
NCDXF Beacons
Eighteen beacons share these five frequencies, ten seconds each. Tune to one and listen — if you hear it, that path is open.
Your Gray Line
Best Band by Hour
DX Path
Next Three Days
The Sun Right Now
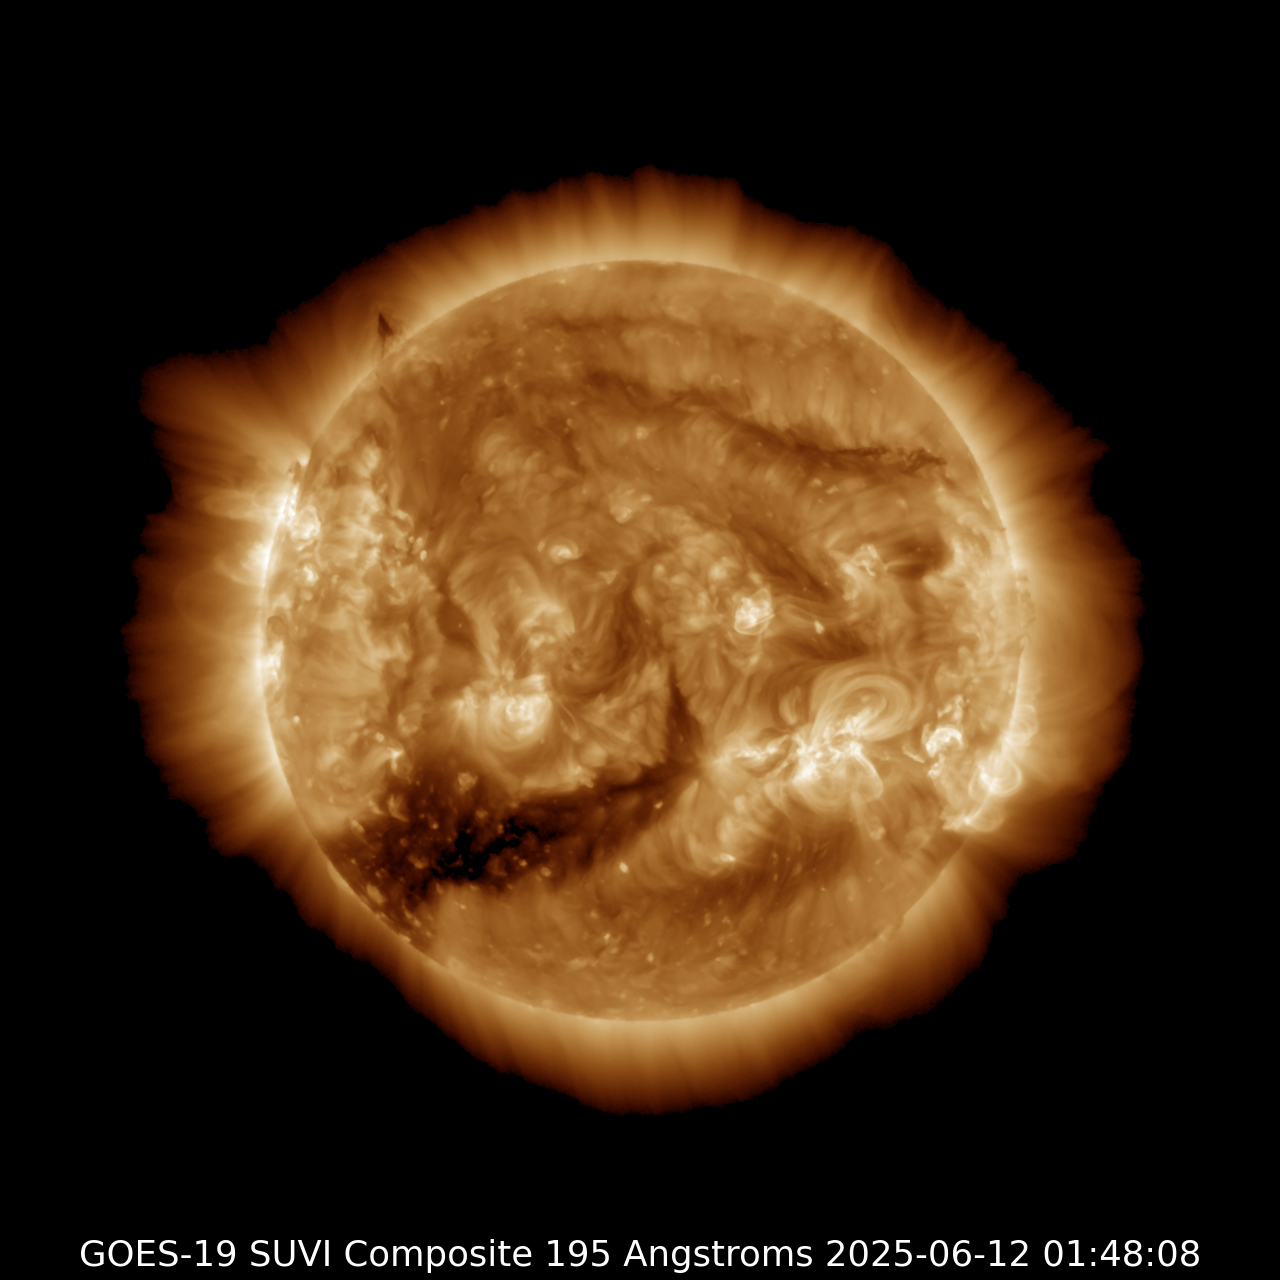
The live solar image could not be loaded just now.
Extreme ultraviolet, from the GOES SUVI instrument. Bright active regions are where flares come from; dark patches are coronal holes, which send out the fast solar wind that lifts the K index a day or two later.
VHF & Above
Straight Answers to the Questions You Actually Have
The dashboard above is live and updating. Everything below explains what it is telling you, in the same plain English the rest of this site uses. Pick the question you came here with.
What Bands Are Open Right Now?
Look at the Band Conditions panel above. It splits the spectrum into day and night groups and rates each one Good, Fair or Poor. That is the fastest honest answer anyone can give you.
Here is the part nobody explains. A band is not a light switch. Open means the ionosphere is currently bending signals on that frequency back down to earth instead of letting them escape into space. Whether it does that depends on how hard the sun has been working on the upper atmosphere, what time it is where you are, what time it is where the other station is, and how far apart the two of you are. The same band can be wide open to Europe and stone dead to the next state over.
So treat the ratings as a starting point, then look at the Best Band by Hour grid. It runs nine bands across twenty-four hours for your own grid square and shades every cell, so you can see at a glance that 40 meters is your best bet at two in the morning and 15 meters is worth a try at noon. That grid is doing out loud the reasoning most operators only pick up after twenty years of sitting at a radio.
Is 20 Meters Open Right Now?
20 meters is the band people ask about most, and with good reason. It is the most dependable long-haul band on HF. On an ordinary day it opens shortly after sunrise, stays useful right through the daylight hours, and often hangs on for a while after dark. When solar activity is running high it can stay open around the clock.
For right now, check the 30m–20m row in the Band Conditions panel. Then find the 20 meter row in the hour grid to see how much of today you have left before it closes.
If 20 is rated Poor, do not write the day off. Poor usually means the band has gone short, with signals coming back down closer to home instead of skipping across an ocean. That is a bad afternoon for Japan and a perfectly good one for three states over.
What Is a Good Solar Flux Index for Ham Radio?
Solar flux is the number most operators check first. It measures radio energy coming off the sun at 2800 MHz, read once a day at the Dominion Radio Astrophysical Observatory in Penticton, British Columbia. Think of it as a stand-in for how hard the sun is working on your ionosphere.
Higher is better, and the higher bands care the most.
Below 70
The quiet sun, and about as low as it goes. 80 and 40 meters still work. Do not expect much from 15, 12 or 10.
70 to 90
Modest. 20 meters is your workhorse, and 17 or 15 may crack open in the middle of the day.
90 to 140
Good. 20 and 17 are dependable, 15 opens regularly, and 10 meters starts showing signs of life.
Above 140
Excellent. The high bands come alive, and 10 and 12 meters can carry a signal worldwide on very little power.
One number never tells the whole story. Solar flux measures what the sun is putting out. The K index below measures whether the earth’s magnetic field is calm enough for you to make use of it. A high flux with a stormy K index is a frustrating day at the radio.
What Does the K Index Mean for Ham Radio?
The K index describes how disturbed the earth’s magnetic field is, on a scale of 0 to 9, updated every three hours. If solar flux tells you how much fuel the ionosphere has, the K index tells you whether something is busy wrecking it.
Unlike solar flux, lower is better.
K 0 to 1
Very quiet. About as good as it gets. Polar paths and long north-south runs behave themselves.
K 2 to 3
Unsettled but normal. Most paths work fine. The far north starts getting noisy.
K 4
Active. Signals crossing the poles begin to flutter and fade, and long-haul paths turn unreliable.
K 5 and Above
A geomagnetic storm. HF can degrade badly or black out at high latitudes, though aurora may hand VHF operators something rare.
You will also see an A index on the dashboard. That is the same information rolled into a single daily figure instead of a three-hour snapshot, so it tells you what sort of day it has been rather than what the last few hours were like.
When Is the Gray Line at My Location?
The map at the top of this page draws it for you, and the panel underneath gives you the exact times for your grid square. Enter your grid in the box above and you get your own sunrise and sunset, and how long until the next one.
The gray line is the band of twilight that circles the earth, the moving boundary between where the sun has just set and where it is just coming up. For roughly half an hour either side of your sunrise and sunset, something useful happens. The D layer of the ionosphere, which spends all day soaking up low-band signals before they get anywhere, collapses much faster than the F layer above it. For a little while you get the F layer’s reflection without the D layer’s absorption.
What that means in practice is that 160, 80 and 40 meters can carry a signal thousands of miles at gray line, on power levels that would go nowhere at noon. Better still, any station sitting on the same gray line as you is having the same experience at the same moment, which is exactly why operators plan contacts around it.
When Is the Best Time to Work DX?
There is no single answer, because it depends entirely on which band you are on.
The high bands — 20, 17, 15, 12 and 10 meters — follow the sun. They need daylight somewhere along the path, so your best windows are during your own daytime, and often in the couple of hours after your local sunset while the path westward is still lit.
The low bands — 160, 80 and 40 meters — do the opposite. They want darkness, and their finest moments come at night and at gray line.
The DX Path panel does the arithmetic for one specific target. Type in the other station’s grid square and you get the distance, the heading to point your beam, their local solar time, and whether either end of the path is sitting near its gray line. If both ends are, stop reading and get on the air.
A Free HamClock Replacement That Runs in Your Browser
If you found this page because your HamClock stopped updating, here is what happened. Elwood Downey, WB0OEW, wrote HamClock and gave it to the hobby for years. He became a silent key on January 29, 2026, and in June 2026 the servers that pushed data out to every HamClock in the world went quiet. The hardware still powers up. The numbers just do not change anymore.
This dashboard is not HamClock and does not try to be a clone of it. It runs in any browser — on your phone, a tablet, or the screen already sitting in your shack — with nothing to install, no account to create and no Raspberry Pi to look after. Space weather comes straight from NOAA and band conditions from N0NBH, and every feed is fetched and cached separately, so one source going quiet cannot take the whole thing down with it. That was the lesson worth learning from all of this.
Tap any number on the dashboard and it will tell you what that number means and what to do about it. That is the part HamClock never set out to do, and it is the reason this exists.
Know What the Bands Are Doing Before You Key Up
Bookmark this page and give it ten seconds before you sit down at the radio. Then go find out exactly where your license lets you operate, and what to say once you get there.